Lesson 5: Representational Data Quality
Representational data quality describes how well data reflects information in a way that its users can comprehend. This dimension of data quality includes the format and meaning of the data, including the extent to which users can understand what the data represents (understandability), grasp units and definitions of data elements (interpretability), and relate current data to older data (consistency).
Representational data quality issues arise when a disconnect occurs between the technical and human side of information systems. Often, things that make data more efficient to track, store, or analyze also make that data harder for humans to understand. For example, the Bureau of Justice Statistics releases annual data about state prison populations in comma separated values (CSV) format—essentially a list of variables and values separated by commas. CSV files are small and download quickly because of their simplified format, but without a program that can parse this data into rows and columns (e.g., Excel), it can be difficult to make sense of numbers and commas in a plain text file. Data with high representational data quality balances the technical aspects of the data with the needs of the data users.
Ensuring high representational data quality is vital to supporting effective decision-making and operational efficiency within any administrative data system. In corrections, this means making sure data users are aware of what information the data represents and any limitations, so that conclusions drawn from the data are appropriate. Comprehensive data documentation, staff training, and data audits are key to achieving high representational data quality in a dataset.
Ensuring high representational data quality means ensuring confidence that the data means what users (anyone who will access, analyze, interpret, or manipulate the data) think it means. Maintaining high representational data quality is important for these main reasons:
- Decision-making: Stakeholders and DOC leadership make decisions using analysis and predictions based on data that is presented clearly and is comparable from year to year.
- Efficiency: Data that is confusing or inconsistent can require additional reviews and cleaning, which can subsequently cause delays in data analysis and reporting.
- Trust: High representational data quality ensures that any users, stakeholders, and analysts can rely on the data to be unambiguous, clear, and reliably stable.
- Compliance: Maintaining high representational data quality is important for accurate reporting and meeting regulatory requirements.
As mentioned in the previous lesson on contextual data quality, the different dimensions of data quality are related to one another. The representational quality of a dataset is impacted by its intrinsic and contextual quality, so it’s important to assess and maintain the quality of your data in those dimensions as well. Data that is understandable and consistent (i.e., with high representational quality) but also inaccurate (low intrinsic quality) or incomplete (low contextual quality) may not be very useful.
Representational data quality consists of three attributes: (1) understandability, (2) interpretability, and (3) consistency. These attributes are important in assessing whether your data represents information in a way that users can follow and is comparable over time. While consistency is an objective measure of representational data quality, understandability and interpretability depend on the contents of the data and the intended user.
| Quality Attribute | Definition | Example |
|---|---|---|
| Understandability | The extent to which data are clear, without ambiguity, and easily comprehended. | Information on gender is stored in a dataset named “Demographics,” and each available gender category is defined in a data dictionary published on the agency’s internal website. |
| Interpretability | The extent to which data are in the appropriate language and the units and definitions are clear. | Sentencing offense is recorded using standardized offense codes known to the agency and used operationally. |
| Consistency | The extent to which data are always presented in the same format and are compatible with previous data. | Metrics and indicators remain constant from year to year and impacts on data or reporting are considered before making any changes. |
The following sections discuss each attribute from the table above in more detail and guide you through questions to consider when beginning to assess representational data quality. Additionally, the components of each attribute are tied to a list of best practices that you and your agency can employ to ensure that your data maintains high representational quality. Explanations for each best practice are also provided along with how you can maintain each practice.
This lesson aims to equip you with fundamental data quality concepts to help you make informed decisions and either advocate for or implement strategies for best practices (when feasible and in your control). Some of these strategies may be easier for you to integrate into your own work (e.g., checking for inconsistencies in data, creating documentation), while others may require policy change within your agency (e.g., data standards, training requirements). This lesson is designed to provide you with an understanding of these concepts so you can evaluate your system and propose solutions based on the best practices for maintaining high representational data quality.
Understandability
Definition: The extent to which data are clear, without ambiguity, and easily comprehended.
The understandability of data refers to users’ ability to comprehend, interpret, and derive insights from the data—for example, being able to understand the nuances and limitations of a particular dataset prior to making knowledge claims. In corrections data, this means that information about incarcerated people, like demographic characteristics, program participation, and sentence information, is recorded in such a way that users can draw appropriate conclusions from it.
Assessing data understandability involves reviewing existing data documentation (data dictionaries, codebooks, and database schemas), as well as the training provided to different types of data users (such as users who input data and users who analyze the data). As this attribute is highly dependent on users, it can be beneficial to get input from data users in various roles about how well they feel they understand the data, how they use the supporting documentation, and whether trainings are sufficient. Data that is easy for one person or group to understand may not be as easy for others to grasp.
Consider the following questions when assessing the policies and practices that impact data understandability at your agency:
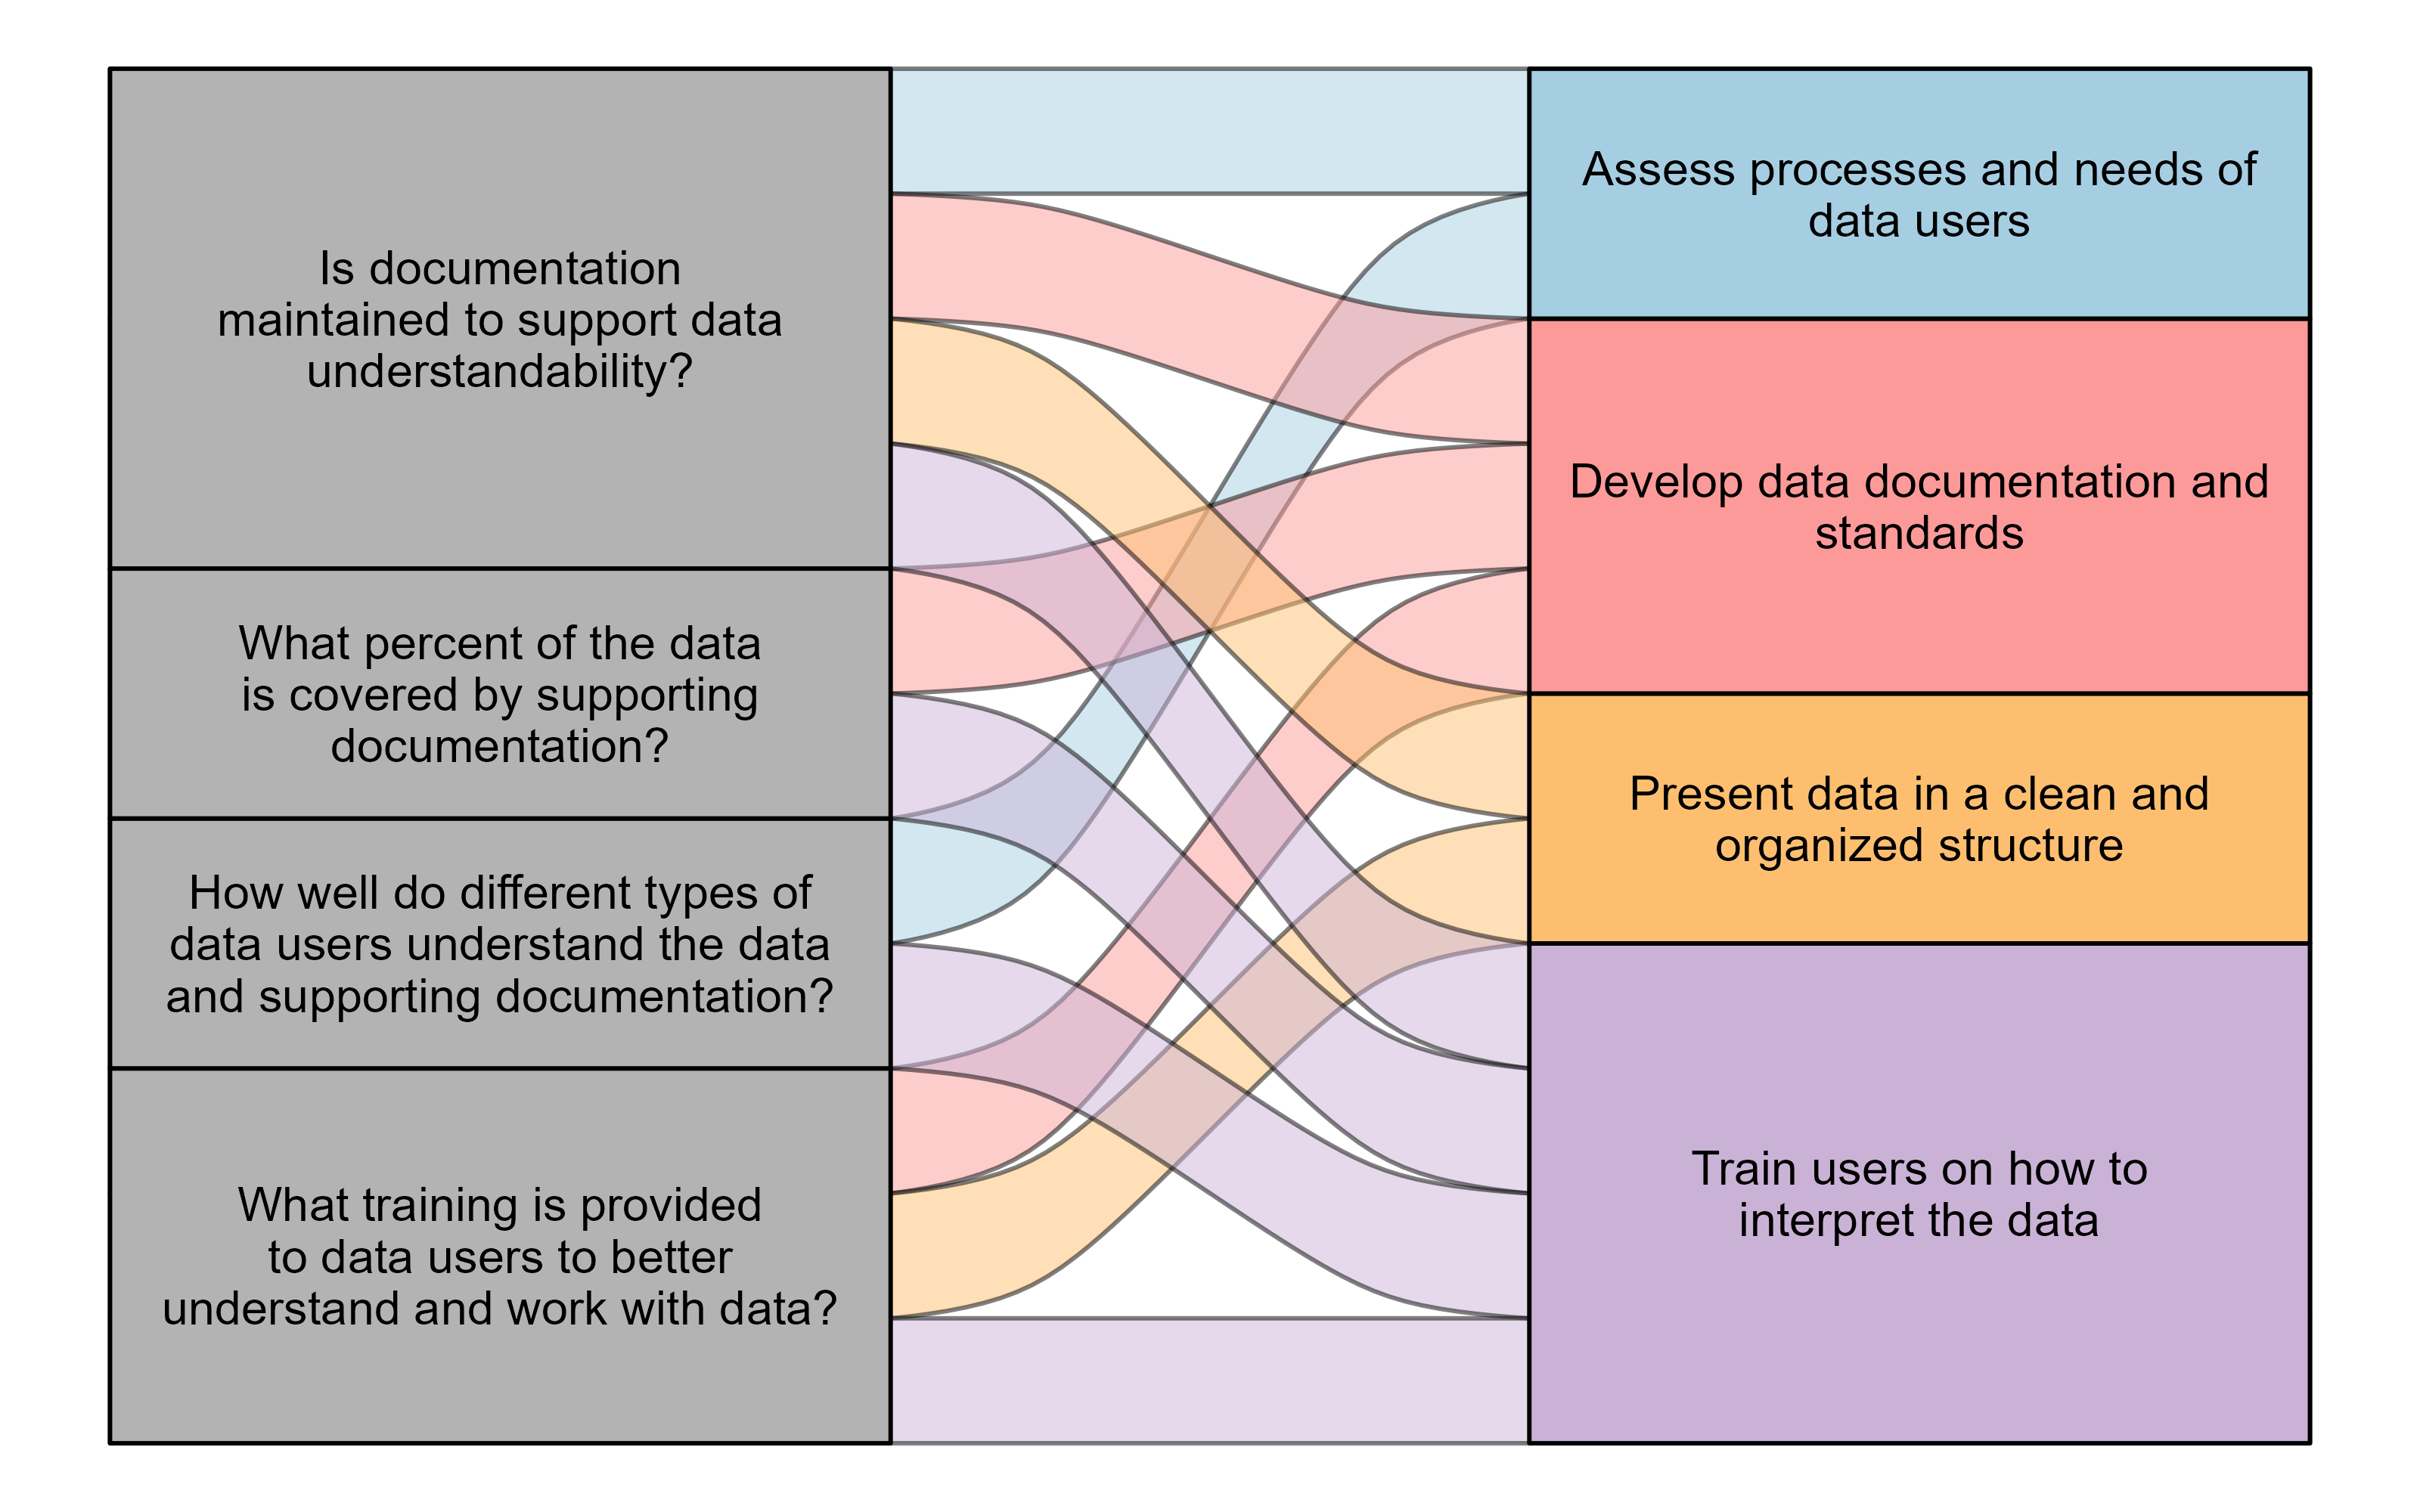
- Is documentation maintained to support data understandability?
- What percent of the data is covered by supporting documentation?
- How well do data users understand the data and its supporting documentation? Does this understanding differ across types of data users (data entry staff, analysts, etc.)?
- What kind of training is provided to data users to better understand and work with data?
The components of understandability highlighted in these questions can all be tied to best practices that you (and your agency) can implement to ensure your data is accurate.
Example
Imagine a scenario where you’re tasked with analyzing mental health assessments conducted by the Department of Corrections (DOC). These assessments are recorded in a separate database, and as you conduct an initial review of this data, you notice some inconsistencies in how results are recorded. After speaking to the staff who conduct these assessments, you realize that there is no standard process for how to enter assessment results, and people rely on their own notes about the database because there is no other documentation available. You work with DOC leadership and assessment staff to develop an official process for recording assessment results in the database and create a data dictionary to help staff understand what should go in each field of the database. You also begin conducting annual trainings for assessment staff on the official data entry process, what the different fields represent, and how this data is used by the DOC.
Interpretability
Definition: The extent to which data are in the appropriate language and the units and definitions are clear.
Interpretability refers to a data user’s ability to parse the information in an accurate manner. Corrections data can come from a variety of sources and information systems, and data is entered and accessed by people with varying knowledge and abilities. Therefore, it’s important to ensure that your data is organized and structured purposefully and that documentation is available to explain the contents and organization of the data.
For data to be interpretable, it also needs to be “human-readable,” meaning it’s displayed in such a way that a person can read and understand it. This can be accomplished by showing values as words rather than numeric codes, using spaces and punctuation to separate text, and using plain language rather than technical jargon or shorthand.
Assessing the interpretability of data requires understanding both how data is recorded and stored (the “back end”) and how it is presented to users (the “front end”). Consider the following questions when assessing the interpretability of data:
- Are metadata1 and documentation provided for all datasets?
- Are the metadata and documentation provided sufficient for understanding the context, meaning, and limitations of data?
- Are data presented to users in a human-readable format?
The components of interpretability highlighted in these questions can all be tied to best practices that you (and your agency) can implement to ensure your data is interpretable.

Example
Each year, federal reporting rules require information about people incarcerated in state prisons, including population counts by gender and race. Imagine that the race categories in the request differ slightly from the categories tracked by your agency. To meet reporting requirements, you create a new variable for this analysis that combines the existing race and ethnicity values in your data into the federal categories. In this new variable, you assign each federal category to a specific number, also known as encoding, in the same order as the request form. Encoding the new race variable makes it easier to fill out the federal form, but without sufficient documentation, there is no way for someone else to know what each number represents. To avoid this problem, you add a label to each value of the new variable so that when the data is viewed, the category name is displayed rather than the numeric value.
Consistency
Definition: The extent to which data are always presented in the same format and are compatible with previous data.
Consistency generally refers to the degree to which data is free from contradictions in content, format, and structure. In corrections data, consistency is important to ensure that data can be combined across sources and compared over time. It can be difficult to programmatically analyze or create automated processes using inconsistent data; code and tools may need to be frequently updated to account for changes to the data. It’s also easy to make mistakes when data are inconsistent, such as not realizing a variable has been removed or not taking new values into account during analysis. Additionally, data that frequently changes can be viewed as unreliable by stakeholders and users.
Consistency can be accomplished through a set of established rules, strict format definitions, and regular data checks. Assessing consistency requires evaluating the structure of the data and the processes for reviewing and maintaining it. Consider the following questions when assessing the consistency of the data:
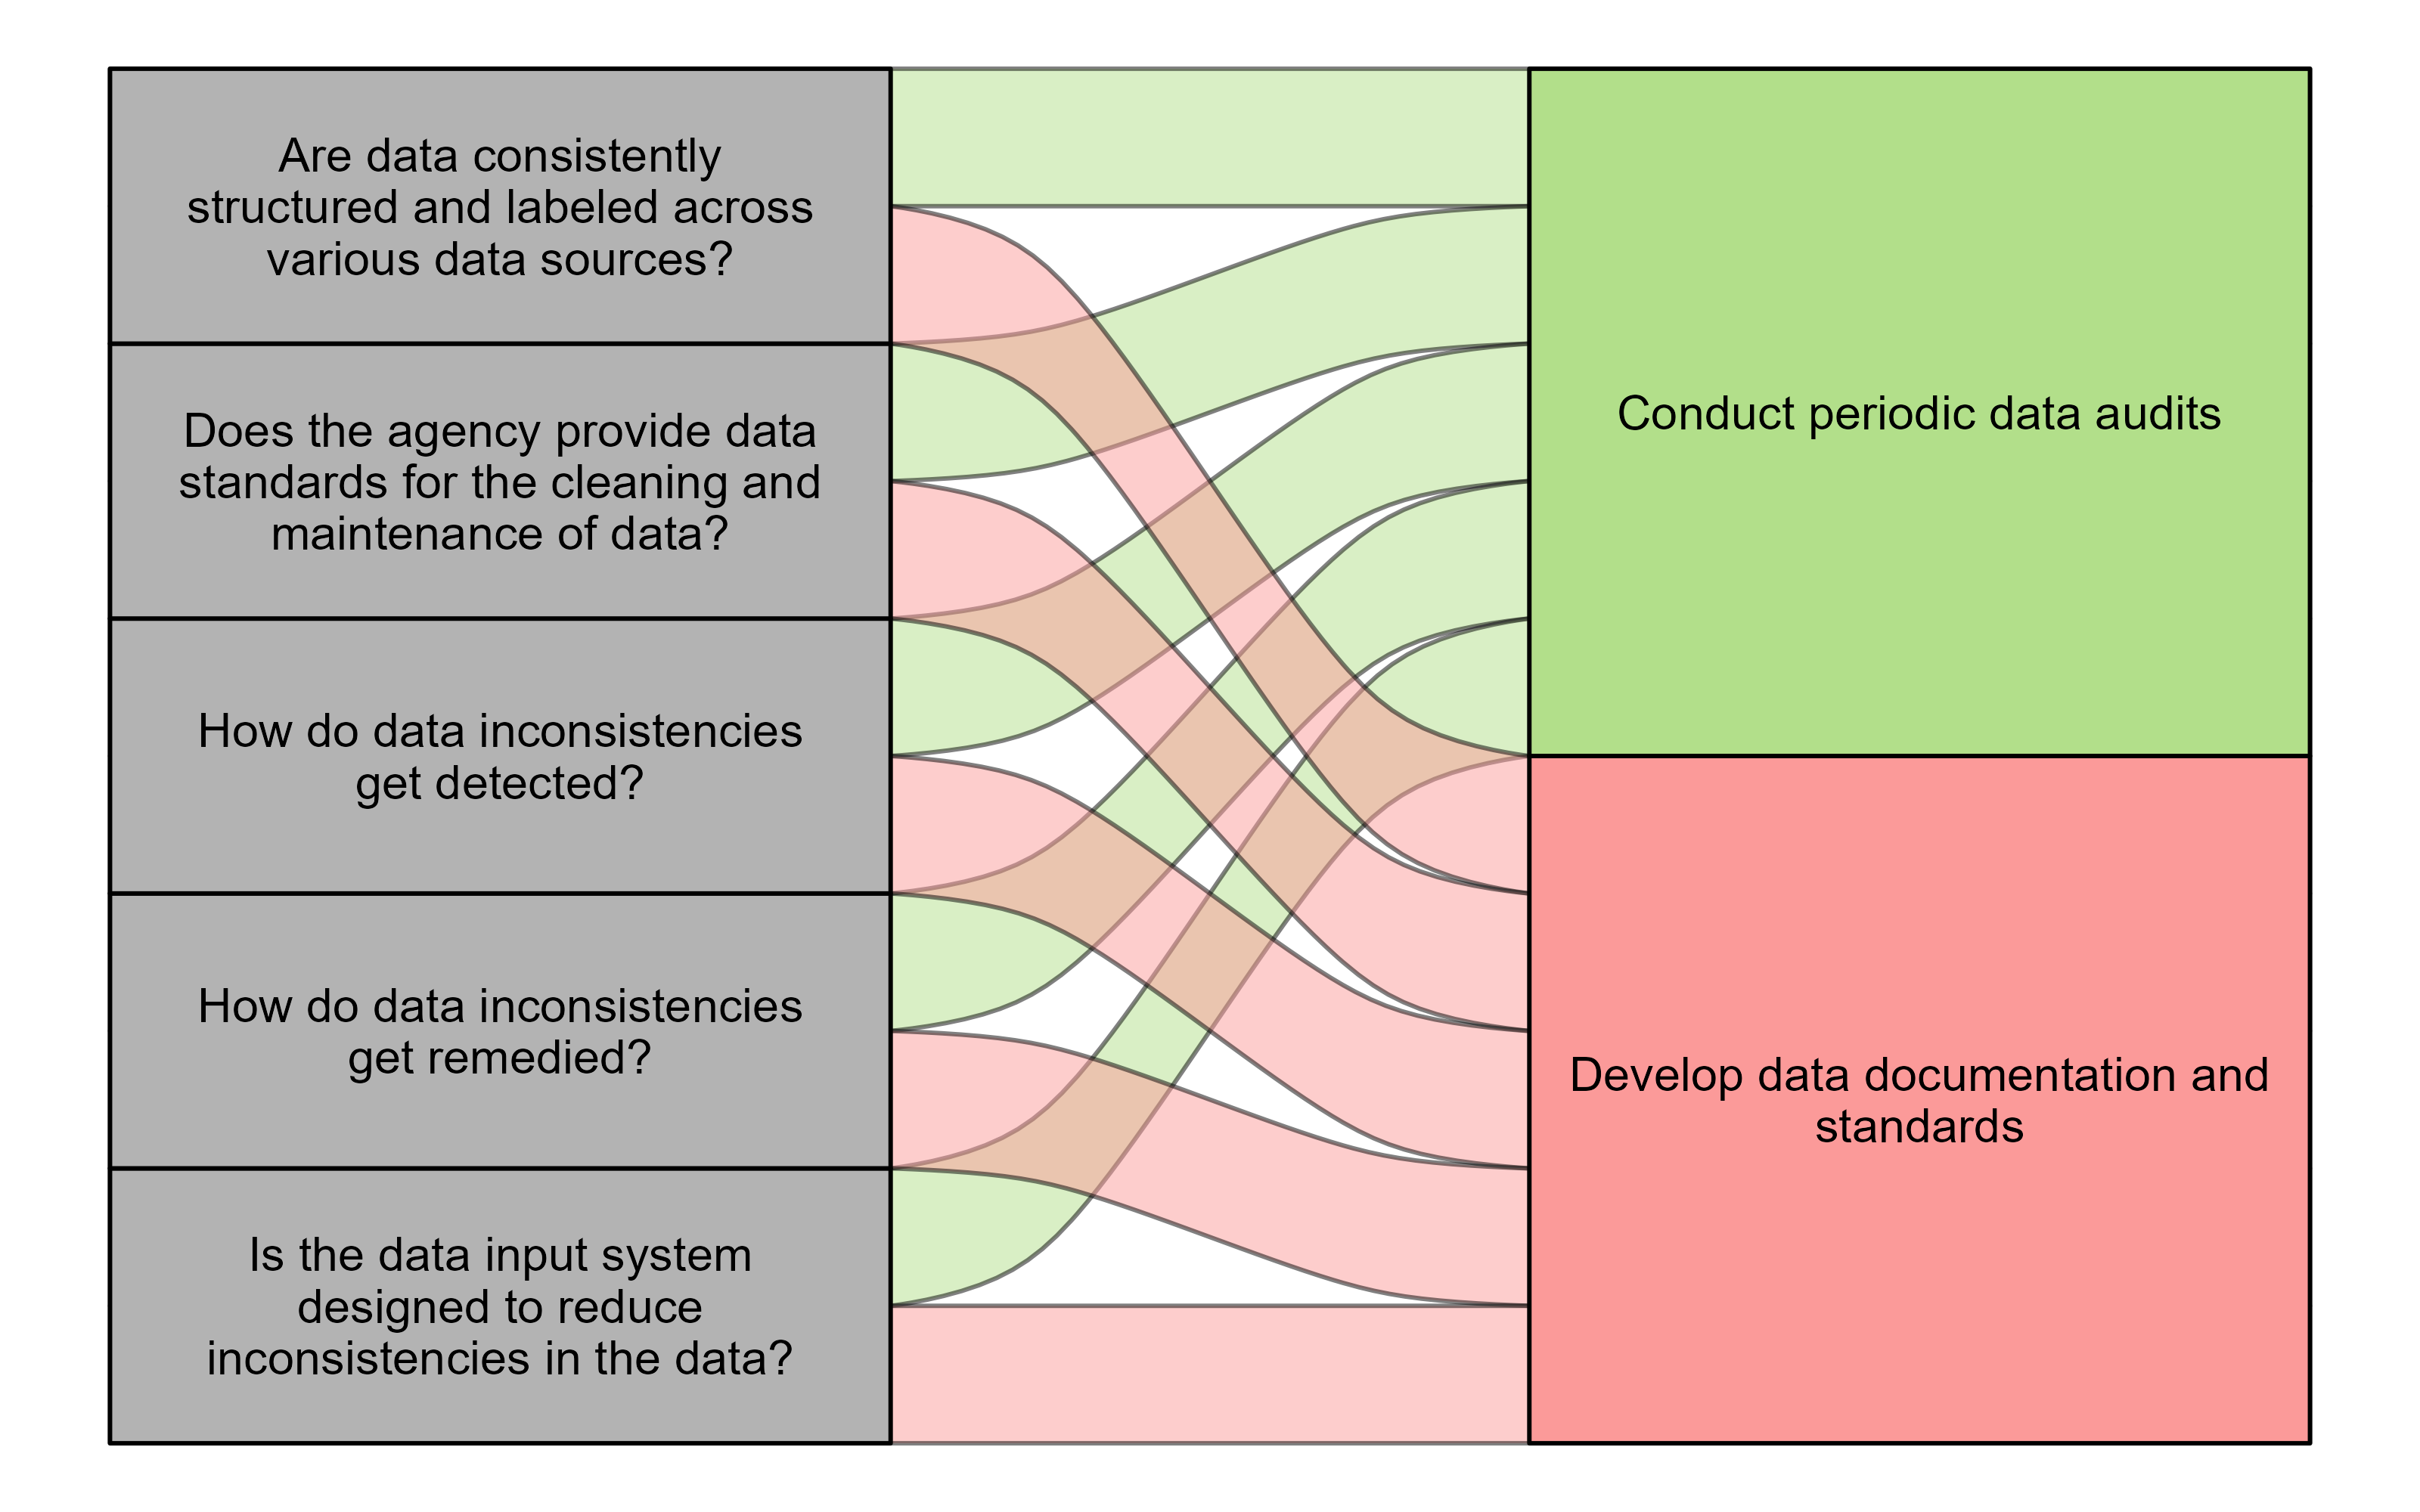
- Are data consistently structured and labeled across various data sources?
- Does the agency provide data standards for the cleaning and maintenance of data?
- How do data inconsistencies get detected?
- How do data inconsistencies get remedied?
- Is the data input system designed to reduce inconsistencies in the data?
The components of consistency highlighted in these questions can all be tied to best practices that you (and your agency) can implement to ensure the consistency of your data.
Example
Imagine a scenario where you receive a monthly data file from a service provider that operates a vocational program in one of your DOC facilities. These monthly files include information on all people who participated in that program during the month, and you combine these files to create an annual dataset for evaluating program outcomes for participants. As you prepare the annual dataset for analysis, you realize that several new variables were added to the monthly file, and new values were added to a few existing variables halfway through the year. Because the new variables were not tracked for people who participated earlier in the year, you can’t use that information for the program evaluation. The report could be delayed because you also have to meet with the service provider to determine how the new values in the data align with older values and then revise your code to incorporate these new values. To avoid similar problems in the future, you work with the service provider to standardize the format of the monthly data and establish a process for communicating any changes to the data. You also develop code to compare new monthly data to older data and flag any differences.
Best practices
Data that has high representational data quality is concise and consistent, as well as easy to interpret and understand.2 If the data can meet these standards, then it’s considered to have “high” representational data quality. However, maintaining high representational data quality is an ongoing process that requires developing and maintaining practices that ensure consistently high-quality data.
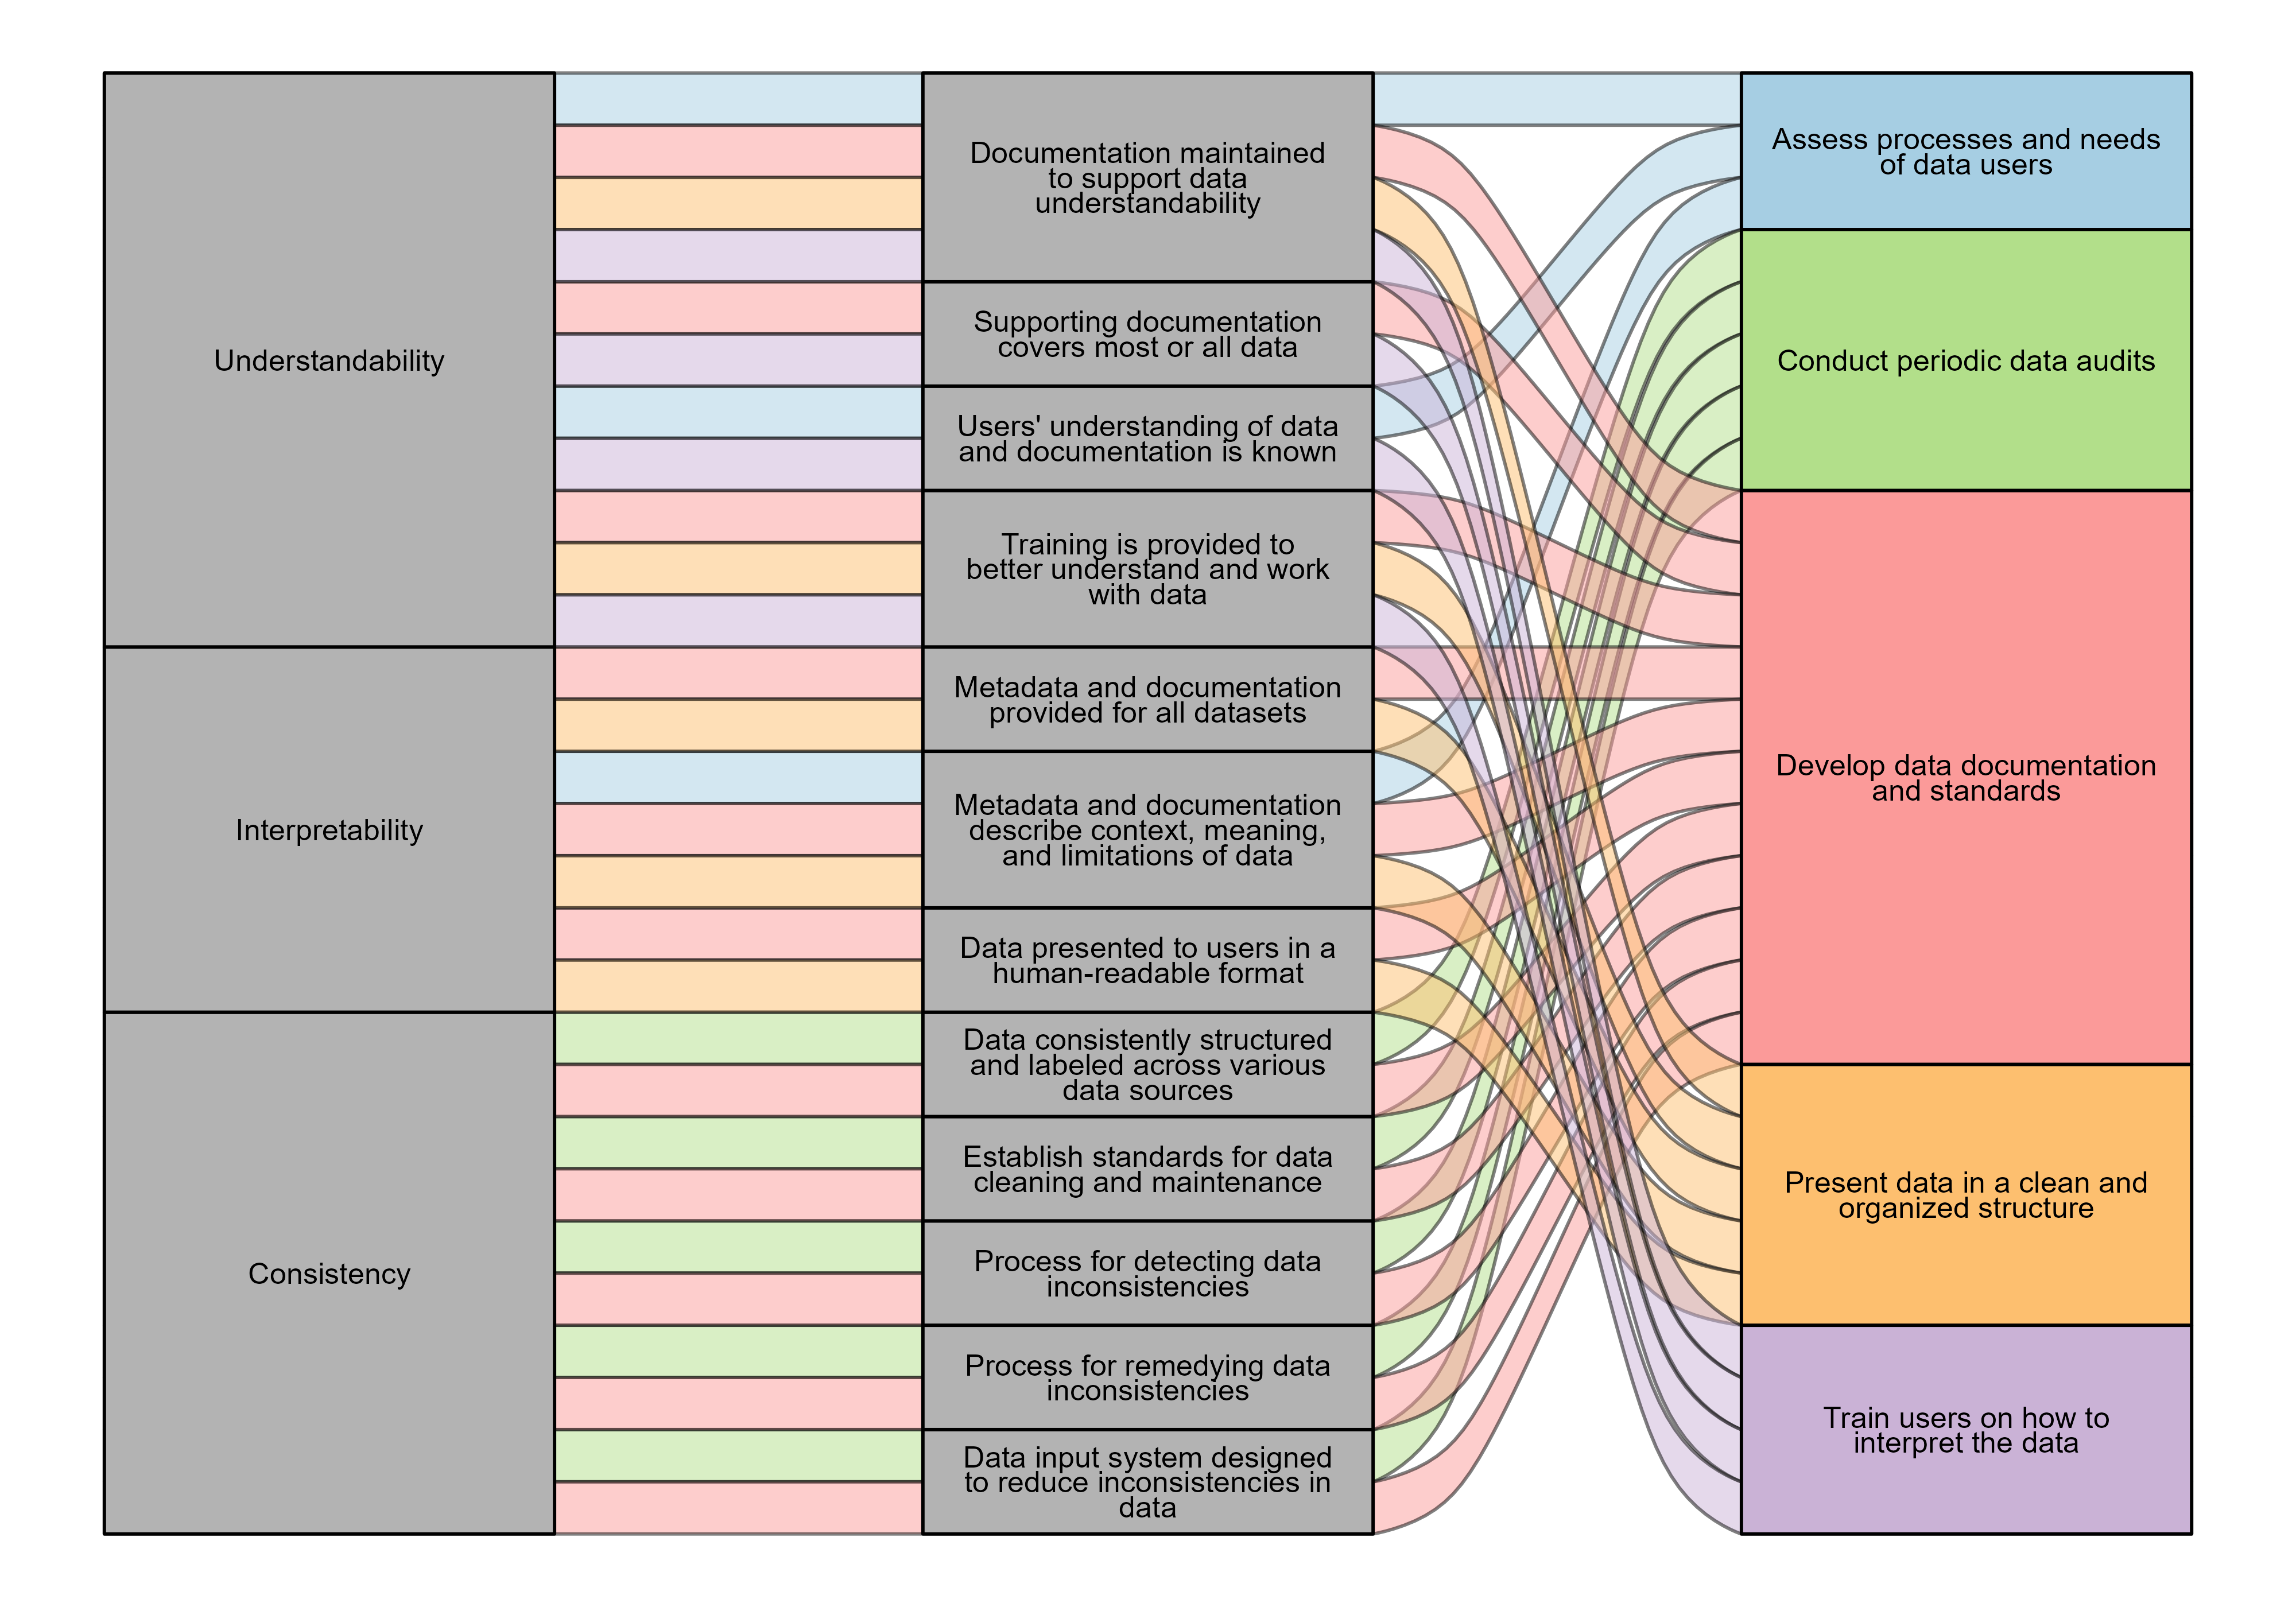
High representational data quality can be maintained through a host of best practices that relate to each of these attributes. In the previous sections, the components of each attribute were connected to specific best practices. The table below lists these best practices and the attributes they are associated with. Each best practice is then further explained, along with steps you (and your agency) can take to maintain these practices and high representational data quality.
| Practice | Attribute |
|---|---|
| Assess processes and needs of data users. | Understandability, Interpretability |
| Develop data documentation and standards. | Understandability, Interpretability, Consistency |
| Train users on how to interpret the data. | Understandability |
| Present data in a clean and organized structure. | Understandability, Interpretability |
| Conduct periodic data audits. | Consistency |
Assess processes and needs of data users
Learn about the day-to-day processes of data users across various roles and positions in your agency. Understand the different ways information is collected, entered into data systems, and used by staff. Determine whether and how supporting documentation is referenced and whether data users find it helpful. Gather this information through staff interviews, job shadowing, focus groups or surveys, or a combination of these methods. Periodically conduct this process and use your findings to update data documentation and trainings.
Develop data documentation and standards
Create data dictionaries or codebooks to enable all users to understand the underlying information and store them in a centralized location that all users have access to. These documents should be written in plain language that all users can understand and should include definitions and data types (e.g., numeric or text), as well as information about how the data was collected and any known limitations. Develop and publish data standards that define the format, structure, and content of data (e.g., data schemas and catalogs) and are in line with existing industry or interagency standards. Include metadata in all data sources, such as descriptions of variables, units of measurement, collection dates, and origin of data3, to allow users to interpret information accurately.
Train users on how to interpret the data
Train staff on how to read and interpret the contents of the data, not just the tools or software that are used to access it. These trainings should be tailored to the needs of different types of data users in your agency and should be conducted in addition to trainings on how to enter data.
Present data in a clean and organized structure
Store data in an efficient format (e.g., categories represented as codes) and present it to users in a clean and organized structure that is human-readable.
Conduct periodic data audits
Set up a periodic audit system to identify inconsistencies internal to each dataset and across data collection. Audits can be conducted through a tool or human review and should include a standardized process for resolving any identified inconsistencies.
These five best practices are designed to help you and your agency maintain data with high representational quality. Some of the suggestions outlined in these practices will be discussed further in future lessons (e.g., strategies for metadata). In the next lessons, we will discuss the last dimension of data quality and tie all the data quality dimensions together, building toward assessing your agency’s data quality standards and developing new strategies for ensuring you maintain high-quality data.
Metadata describes characteristics of a dataset (e.g., file format, variable definitions, when records were created and by whom) but not the actual contents of the data (e.g., specific records or values).↩︎
Richard Y. Wang and Diane M. Strong, “Beyond Accuracy: What Data Quality Means to Data Consumers,” Journal of Management Information Systems 12, no. 4 (1996): 5–33, http://www.jstor.org/stable/40398176.↩︎
Ikbal Taleb et al., “Big Data Quality Framework: A Holistic Approach to Continuous Quality Management,” Journal of Big Data 8, no. 1 (2021), https://doi.org/10.1186/s40537-021-00468-0.↩︎