Missing data, or missingness, refers to incomplete information recorded in a dataset. The incomplete information could be a single variable or an entire record. While problematic, missing data is extremely common, not just in corrections data but across all disciplines and subjects. In fact, it’s rare to encounter data that has no missing elements. It might be fair to say that missing data is the most common type of data.
In administrative data—i.e., information tracked by an agency or organization about its operations and activities—missing data can occur for a variety of reasons:
- Simple mistakes or oversights during data entry, like skipping a question during the intake process or illegible writing on a form
- Gaps in business processes, like incomplete information provided by another source or insufficient training on how to record information
- Technology issues, like importing records from an older data system or not having a designated place to record information
The following sections discuss why missing data is important, how to identify it, and what to do about it. As an analyst, understanding the missingness in your data is essential for conducting reliable and accurate analysis and drawing appropriate conclusions from said analysis. Addressing missing data can help you and your agency improve data practices and capacity for analytics.
Impacts of missing data
While some amount of missing data is inevitable, missingness can cause major problems for data analysis if unaddressed. At a minimum, it can lead to an inaccurate picture of a population or activity. For example, generating population projections using a dataset where 10 percent of records are missing gender could lead you to underestimate the number of beds a new women’s facility would need.
Missing data can impact the results of statistical analysis, as large amounts of missing data can result in small or distorted samples and weak statistical models. If there is a systematic reason for the missing data (i.e., not just random errors), analysis and estimates will be biased—as will any conclusions drawn from them.
Missing data also impacts data quality. Data with a high level of missingness will have lower data quality across all four dimensions:
- Intrinsic: Large amounts of missing data can make data less accurate, and users may view the data as unreliable.
- Contextual: Data with high levels of missingness may be inappropriate or insufficient for meeting user needs.
- Representational: Missing data can be hard to understand and may result in misinterpretations of the data.
- Accessibility: Users cannot access or interact with data that isn’t there.
If certain data points are missing, the data—and any subsequent analysis of it—may simply reflect what is available, rather than an accurate portrayal of what happened. This can lead to misinformed decisions, failure to comply with regulations, or operational inefficiencies.
Checking for missing data
Before conducting any type of data analysis, it’s extremely important to understand the rates and patterns of missing values in your data. What is the prevalence of missing values in the variables you’re interested in? How does the missing data limit your planned analysis? Don’t wait until your analysis is complete to realize that you were missing key information, and your results aren’t accurate or useful.
First, you should explore your data to determine how much data is missing. Assess your data to determine how many variables have missing data and how many records are missing values in each variable.
Example frequency tables of variables:
# A tibble: 3 × 3
  gender     n   pct
  <chr>  <int> <dbl>
1 Female  1427  14.3
2 Male    8141  81.4
3 <NA>     432   4.3
# A tibble: 6 × 3
  race                                  n   pct
  <chr>                             <int> <dbl>
1 American Indian or Alaskan Native   402   4
2 Asian or Pacific Islander            43   0.4
3 Black                               323   3.2
4 Unknown                             175   1.8
5 White                              8621  86.2
6 <NA>                                436   4.4
# A tibble: 6 × 3
  hearing_type     n   pct
  <chr>        <int> <dbl>
1 Disciplinary   216   2.2
2 Medical         27   0.3
3 Other          793   7.9
4 Regular       5068  50.7
5 Revocation    2526  25.3
6 <NA>          1370  13.7
Example frequency tables of flag variables:
# A tibble: 2 × 3
  missing_gender     n   pct
  <chr>          <int> <dbl>
1 No              9568  95.7
2 Yes              432   4.3
# A tibble: 2 × 3
  missing_race     n   pct
  <chr>        <int> <dbl>
1 No            9564  95.6
2 Yes            436   4.4
# A tibble: 2 × 3
  missing_hearing_type     n   pct
  <chr>                <int> <dbl>
1 No                    8630  86.3
2 Yes                   1370  13.7
In addition to the number of records with missing data, you should also examine how the data is missing. Look for patterns in missing data by comparing records with and without information in the variable(s) of interest. Keep in mind that different variables may have different patterns of missing data.
Example frequency table of a binary flag and another variable:
            missing_hearing_type
hearing_year   No  Yes
        2016  922    0
        2017 1051    0
        2018    0 1370
        2019 1446    0
        2020 1250    0
        2021 1273    0
        2022 1372    0
        2023 1316    0
Example frequency tables for total and non-missing records:
# A tibble: 4 × 5
  risk_level n_total pct_total n_with_gender pct_with_gender
  <fct>        <int>     <dbl>         <int>           <dbl>
1 Low            679       6.8           438             4.6
2 Medium        4240      42.4          4140            43.3
3 High          4598      46            4514            47.2
4 <NA>           483       4.8           476             5
Example frequency table and Chi-square test results:
          missing_gender
risk_level   No  Yes
    Low     438  241
    Medium 4140  100
    High   4514   84
    <NA>    476    7
    Pearson's Chi-squared test

data:  risk_by_missing_gender
X-squared = 1714.6, df = 3, p-value < 0.00000000000000022
In addition to missing values, it can also be helpful to check variables for high rates of “other” or “unknown” values. This could indicate that the categories available do not adequately represent your population, and it can cause some of the same issues as missing data.
The information you gather about how much data is missing and whether there are patterns to it can help you understand why the data is missing. Understanding why data is missing can help you develop strategies for reducing missingness in your data, such as checklists for data entry, staff training, or adding options to fields.
Talk to the people responsible for entering the missing information about the patterns you found, as their perspectives can provide valuable context about their workflow and how data is recorded. Perhaps there were many new staff assigned to a specific shift, resulting in more data entry errors than expected for a few weeks, or the available options for a data field haven’t been updated to include a new program, so staff were forced to leave it blank.
In figure 3 above, all the records that were missing hearing type were hearings that happened in 2018—there could have been an event that impacted data records for a specific period, such as converting to a new data system. If there are no identifiable patterns in the missing data, the missing information may simply be due to random data entry errors.
Types of missing data
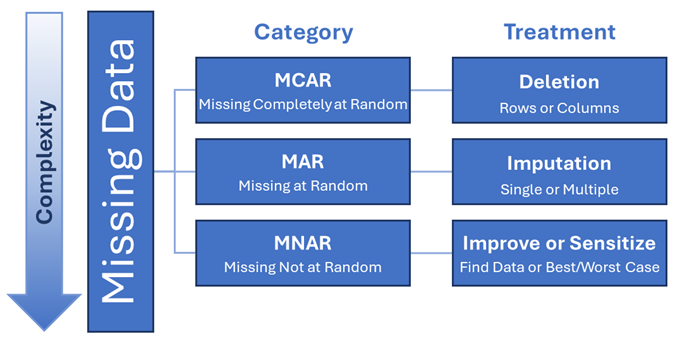
Depending on how you’re using a dataset, knowing the type of missingness can often be just as important as the amount of missing data. There are three main types of missing data, based on how the missing information is distributed across the data.
| Missing Completely at Random (MCAR) |
There is no pattern as to which values are missing or which records have missing values. Records with missing values are not systematically different from those without. All records have the same likelihood of being missing. |
Records with missing education level are due to randomly occurring data entry errors made by staff over time. |
| Missing at Random (MAR) |
|
Records imported from an older data system are missing education level because it was not recorded in the older system. |
| Missing Not at Random (MNAR) |
Records with missing values are systematically different from those without. This difference is not explained by values in other variables. The probability of missing data in a variable depends on the missing value itself. |
Records for people who did not finish high school are missing education level because there is no option for “some high school” in that field (i.e., missing education data is predicted by not finishing high school). |
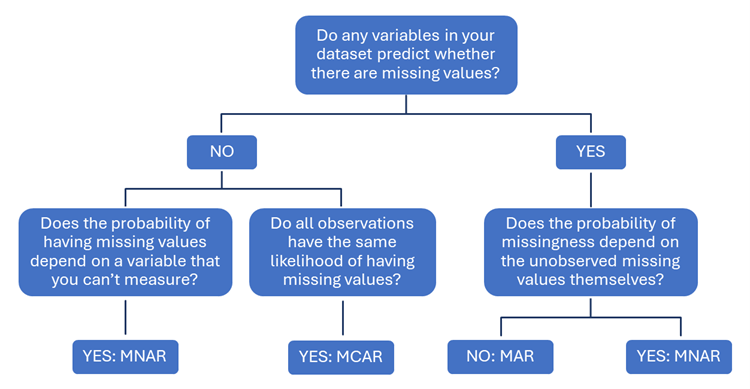
To identify the type of missingness in your data, conduct logistic regressions on your data using the binary flag you created to group records with missing values in your variable of interest. The results of these regressions will show if any variables in your dataset predict whether there are missing values in that variable.
- Data are MCAR if no variables in your dataset predict whether there are missing values, and all observations have the same likelihood of having missing values.
- Data are MNAR if no variables in your dataset predict whether there are missing values, and the probability of having missing values depends on a variable that you can’t measure; or if any variables in your dataset predict whether there are missing values, and given all the observed variables, the probability of missingness depends on the unobserved missing values themselves.
- Data are MAR if any variables in your dataset predict whether there are missing values, and the probability of missingness does not depend on the unobserved missing values themselves.
The flowchart below shows how this information can help you identify the type of missingness in your data.
It’s good practice to consider both the amount and type of missingness when checking for missing data and deciding how to resolve it. For example, a dataset with a small number of MNAR records could be more problematic than a dataset with a moderate number of MCAR records.
Dealing with missing data
The best way to address missing data operationally is to conduct regular data audits with processes for identifying and resolving data entry errors. Many of the best practices for maintaining data quality discussed in the previous lessons can help you assess and reduce the missingness of your data. At the agency level, having policies and guidance for collecting and recording data and frequently training staff on these processes can help minimize errors in data entry. Periodic data audits can help identify missing values or incomplete records as they arise, rather than discovering data issues during analysis when it’s often too late to correct them.
Increasing the quality of your data is a long-term process, however, and most analysis can’t be put on hold until the data improves. In the short term, you’ll probably have to work with the data as it is, including any missing information, when you analyze it. Fortunately, there are many methods for accounting for missingness in data analysis, ranging from simple to very complex. Data that is MCAR can generally be resolved using fairly simple techniques, while data that is MNAR requires more complex methods.
Before deciding on a method for handling missing data in your analysis, consider the following questions:
- Which variables are missing data? What is the frequency of missing data?
- When working with a sample of data, you should also compare rates and patterns of missing data in your sample to those in the entire population.
- Is there a systematic reason that the data is missing, or is it due to random errors?
- For example, people whose records are missing program outcome information all participated in the same program, and further investigation reveals a problem with how the program provider’s data system transmits information to your agency.
- What type of analysis are you conducting?
- Are you missing data on your control variables or dependent variable? Generally, you should not impute data for your dependent variable.
- What is your sample size?
- For example, if you have a large sample with a low percentage of missing data, using complex missing data techniques may not be worth it.
- Are there patterns in your data that might allow you to fill in missing values?
- For example, you may be able to use repeated records of the same person to fill in missing gender information.
- Is there another way you can operationalize a variable?
- For example, you’re missing data on the number of times a person was previously incarcerated, but you do have data on whether they had ever been incarcerated. To control for criminal history, you create a binary variable for prior incarceration instead.
Depending on the answers to these questions, as well as the type of missingness and how you plan to use the data, you can leave the data as is, exclude records with missing data, impute missing values, or use more advanced techniques.
The following sections will provide a basic overview of some of the methods for dealing with missing data in your analysis. No matter which technique you use, be sure to include the number of records with missing data in any documentation about your data or analysis.
Deletion
Listwise deletion, or complete case analysis, uses only the records that are not missing data in any variable—i.e., complete cases—in the analysis. In other words, records are deleted based on the values across the entire row. This is the most appropriate method to use for descriptive analyses and does not introduce bias in your estimates when data are MCAR.
Listwise deletion can result in small samples if there is a lot of missing data, and this can reduce the power of any statistical models and lead to larger standard errors. It can also change the generalizability of your findings and introduce bias if the missingness is not completely random (MAR or MNAR). However, listwise deletion may be the best way to handle MNAR data if you’re unable to impute values. Just make sure to be transparent about how your sample changes by reporting any differences you find.
Pairwise deletion uses all records that are not missing data in any pair of variables. When conducting analysis that compares two variables, such as computing means, covariance matrices, or correlations, records that are missing data in either variable are excluded. In other words, records are deleted based on the values in a pair of columns.
Pairwise deletion can let you keep more records in your sample than listwise deletion, but it can also result in inconsistent sample sizes because the number of records dropped depends on the variables analyzed. This method can also introduce bias into your analysis if the data are not MCAR. For these reasons, listwise deletion is typically preferred over pairwise deletion
Imputation
Imputation is the process of using existing data to fill in missing values. It’s important to note that the purpose of imputing missing values is not to guess what the actual values should be; rather, the goal is to set up your analysis to approximate the results that could be expected if there was no missing data.
Simple imputation is the recommended approach if your data are MAR. There are several simple imputation techniques that are commonly used to replace missing values, including the following:
- Mean imputation: Missing values are replaced with the average of all non-missing values.
- Hot deck imputation: Missing values are replaced with a randomly chosen value from an individual in the sample who has similar values on other variables.
- Cold deck imputation: Missing values are replaced with a systematically chosen value from an individual who has similar values on other variables.
- Last observation carried forward: In a longitudinal dataset, missing values are replaced with the previously observed value for the same individual.
The downside to simple imputation is that using existing data to substitute missing cases does not add any new information to your data and artificially reduces the variation in your data. Some methods, like last observation carried forward, assume that values have not changed over time, which may not be true for your data.
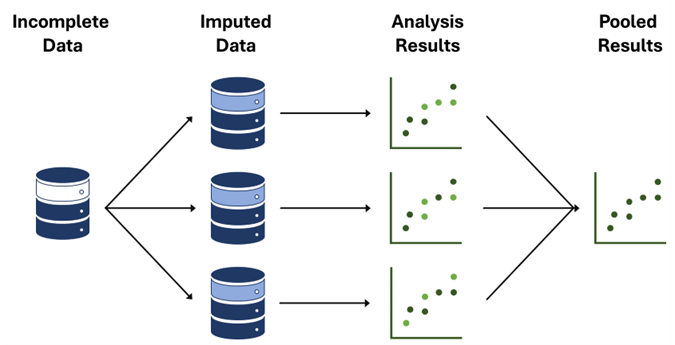
Multiple imputation through chain equations (MICE) is a commonly used imputation technique where instead of filling in a single value, the distribution of the observed (i.e., actual) data is used to estimate multiple values, in multiple datasets, that reflect the uncertainty about what the missing value is. These estimated values are then used in the analysis of interest, such as a logistic regression, and the parameter estimates (e.g., coefficients and standard errors) and results from each analyzed dataset are then combined. By creating multiple estimated values and analyses, this method can offset the artificially reduced variation in data that can happen with simple imputation.
Other techniques
The methods presented here are only a small subset of approaches for dealing with missing data. As mentioned above, data that is MNAR is resolved through complex techniques that may require external tools or advanced statistical knowledge. While they will not be covered in this lesson, some examples of other methods for addressing missing data are as follows:
- Bayesian Improved Surname and Geocoding (BISG) uses last names, geocoding, and Census data to impute race and ethnicity.
- Predicting Gender Using Historical Data, is an R package that uses historical Census and Social Security Administration data to estimate gender based on first names.
- Random Forest is a machine learning algorithm that takes the most common result from multiple predictions based on different decisions.
- There is no one-size-fits-all approach for dealing with missing data.
- Explore and know your data.
- Select the appropriate techniques for your data.
- Assess the impact on your results.
- Present your results along with their limitations.
There aren’t necessarily rigid rules for deciding how to deal with missing data. Each technique comes with trade-offs related to the assumptions you make; some are easier to implement than others but may introduce bias, while some introduce less bias but are harder to implement. You may even want to try multiple techniques (e.g., pairwise deletion and MICE) to test the sensitivity of your findings—how much do the results of your analysis change based on the method you used to resolve the missing data? Whatever method(s) you use, make sure to be transparent about the amount and type of missing data, how you handled missing data, and the limitations of your approach.
Further reading
Below are some additional resources with more detailed information about missingness and methods for addressing it.
- Andrew Gelman and Jennifer Hill, “Missing-data imputation,” in Data Analysis Using Regression and Multilevel/Hierarchical Models (Cambridge: Cambridge University Press, 2006), 529. http://www.stat.columbia.edu/~gelman/arm/missing.pdf.
- David R. Johnson and Rebekah Young, “Toward Best Practices in Analyzing Datasets with Missing Data: Comparisons and Recommendations,” Journal of Marriage and Family 73, no. 5 (2011): 926–945, https://www.jstor.org/stable/41329640.
- Donald B. Rubin, “Inference and Missing Data,” Biometrika 63, no. 3 (1976): 581–592, https://doi.org/10.2307/2335739.
- Farah Adibah Adnan et al., “A Review of Current Publication Trends on Missing Data Imputation Over Three Decades: Direction and Future Research,” Neural Computing and Applications 34 (2022): 18325–18340, https://doi.org/10.1007/s00521-022-07702-7.
- Hyun Kang, “The Prevention and Handling of the Missing Data,” Korean Journal of Anesthesiology 64, no. 5 (2013): 402–406, https://doi.org/10.4097/kjae.2013.64.5.402.
- Jayson Nissen, Robin Donatello, and Ben Van Dusen, “Missing data and bias in physics education research: A case for using multiple imputation,” Physical Review Physics Education Research 15, no. 2 (2019): 020106, https://doi.org/10.1103/PhysRevPhysEducRes.15.020106.
- Paul Madley-Dowd et al., “The proportion of missing data should not be used to guide decisions on multiple imputation,” Journal of Clinical Epidemiology 110 (2019): 63–73, ,https://www.jclinepi.com/article/S0895-4356(18)30871-0/fulltext.